Grafana
Grafana is the tool we use to visualize the data we have in Timescale now. Setting it up will involve the following steps:
-
Create a new Grafana instance
-
Add a datasource
-
Create a new dashboard
|
Costs
Grafana offers a "free plan", which is sufficient for our workshop. If you already have a Grafana instance, you can of course re-use that instance too. |
Create instance
Log in to Grafana Cloud, and add a new stack using one of the Add stack buttons. Select a region that matches the other services and an instance URL that works for you. Once the deployment is ready, just navigate your browser to the instance and sign in.
Adding a datasource
As a first step, we need to let Grafana know where to get data from. So navigate to and click the Add data source button. Select the "PostgreSQL" data source type, which should be installed by default to your instance.
For filling out the form, you will need the following information from the previous steps:
-
TimescaleDB hostname and port
-
Credentials of the "dashboard" timescale user
Fill out the form:
Field |
Value |
Description |
Name |
|
A name for the datasource |
PostreSQL connection |
||
Host |
|
The hostname and port number of your TimescaleDB instance |
Database |
|
The database name, normally |
User |
|
The username of the "dashboard" user |
Password |
|
The password of the "dashboard" user |
TLS/SSL Mode |
|
Require TLS validation |
PostreSQL details |
||
Version |
|
The PostgreSQL version |
TimescaleDB |
|
Activate this, as we are connecting to a TimescaleDB instance |
Min time interval |
|
Lower to one second, to get more accurate data |
All other fields can be left with their default values.
Click on the Save & Test button, you should get a confirmation that the connection is ok.
Create dashboard
The next step is to create a new dashboard, which makes use of the datasource we just added. Click on in the left sidebar menu and press the Add a new panel button.
| Grafana allows all kinds of customizations and tweaks. Creating beautiful dashboards can be fun. However, in this workshop we focus on the important point. But if you like, feel free to spend some time in polishing your dashboards. |
|
Save early, save often!
We don’t mention this explicitly in the following section, but be sure to safe your dashboard occasionally after making changes. |
A first panel
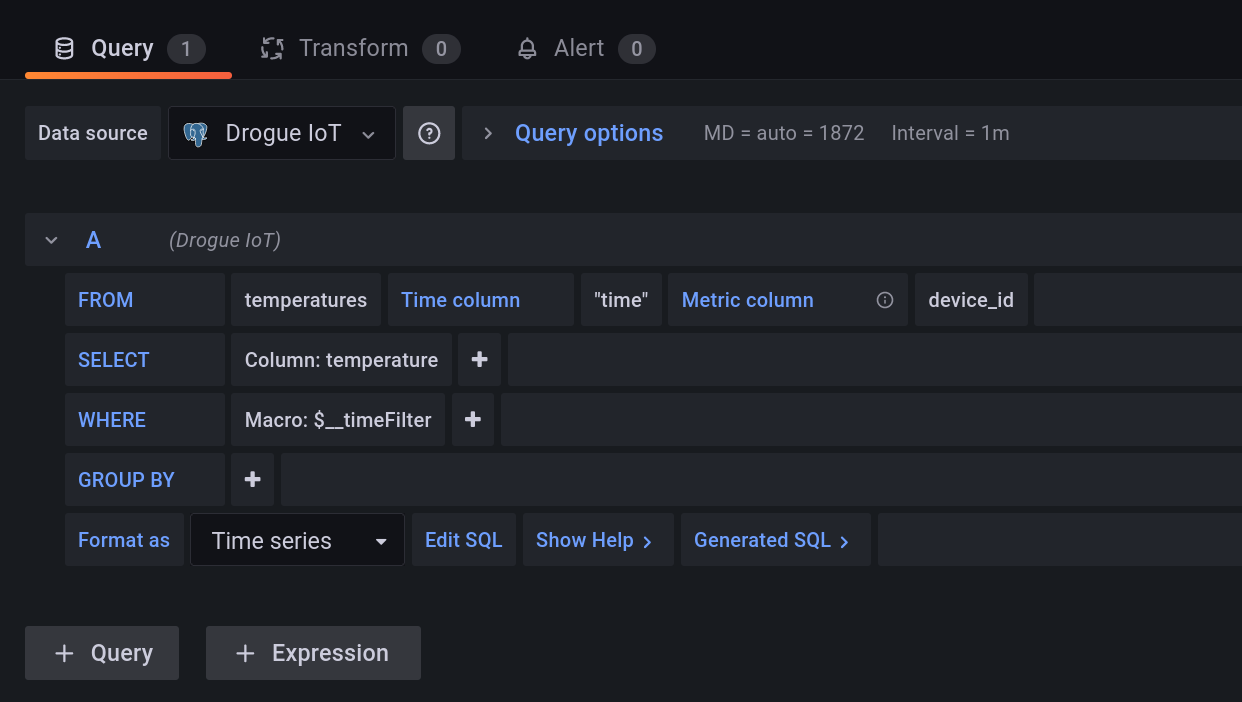
This will give you a new chart, with a dummy datasource. Update the datasource and query to show the temperatures value we added previously:
| Setting | Value | Description |
|---|---|---|
Datasource |
|
The datasource connecting to TimescaleDB |
|
|
The name of the table |
Time column |
|
The name of the field containing the timestamp |
Metric column |
|
The name of the metric, in our case, this is the device id |
|
Column: |
The field of the actual value |
|
Macro: |
A macro, creating the |
Leave the other values to their defaults:
Don’t forget to press the Apply button, so commit the changes to the dashboard and exit the "Edit panel" mode.
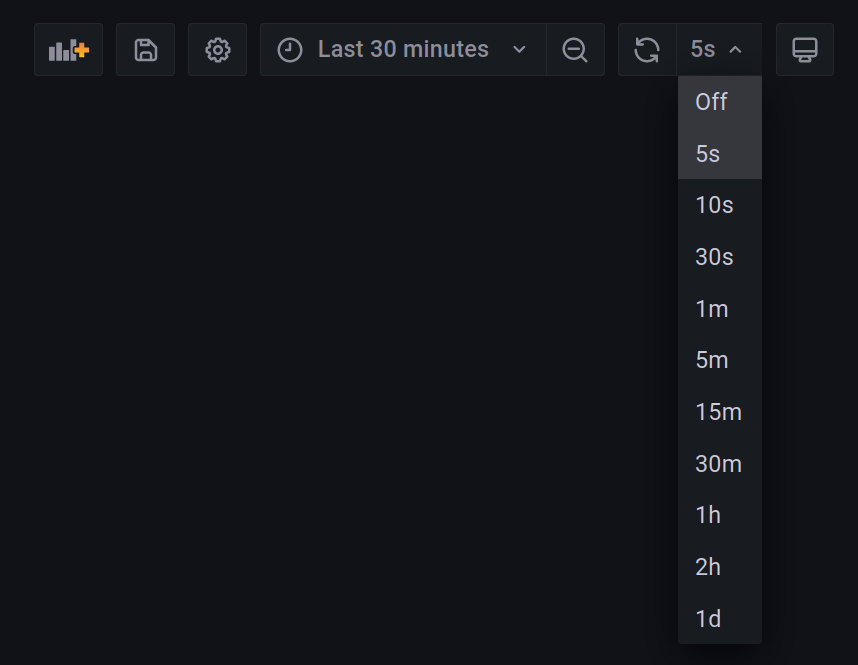
Time window & Auto-reload
In order to better see when experimenting with data, let’s change the time window to 30 minutes. You can do this in the upper area of the screen:

Also, by default the dashboard does not update data automatically. This can be changed by expanding the drop-down menu of the refresh menu and selecting a refresh period:
Filtering by device
Currently, this query shows all devices at the same time. With Grafana you can allow the user to select one or more devices, to focus more on specific data.
Navigate to the dashboard settings (the cogwheel button in the top section of the screen). Then navigate to and add a new variable using the Add variable button.
Enter the following information:
| Setting | Value | Description |
|---|---|---|
General |
||
Name |
|
The name of the variable |
Type |
|
Values are acquired by executing a query |
Label |
|
Shows "Device" instead of "device_id" in the UI |
Query options |
||
Data source |
|
The datasource used for the query |
Refresh |
On time range change |
Refreshes whenever the dashboard is reloaded, so we also get newlyl added devices. |
Query |
|
SQL query to get all device IDs |
Selection options |
||
Multi-value |
|
Allow selecting one or more devices |
Include All option |
|
Allow selecting "all" devices |
Leave the other fields with their defaults and commit the change using the Update button.
We will need to adapt the query, to add the variable as a filter in the where clause. Click on the title of the panel and select the menu entry. This will bring you back to the query settings.
Find the row that starts with the WHERE clause, and add a new element by pressing the + button, choose to
add an "Expression". The first part of the expression is the field, choose device_id by clicking on the section of
the element. The second part is the value to test for.
Now the value part is a bit trickier. It could be a single device ID, it could be multiple device IDs, or none at all.
No worries, SQL has you covered, and you can use the following expression: ANY(ARRAY[$device_id]::varchar[]), which
performs a check if the value of the field (device_id) is in the provided array. Which also is true if the array is
empty.
Apply the changes again. Then you can use the drop-down labeled Device, in the top of the dashboard:
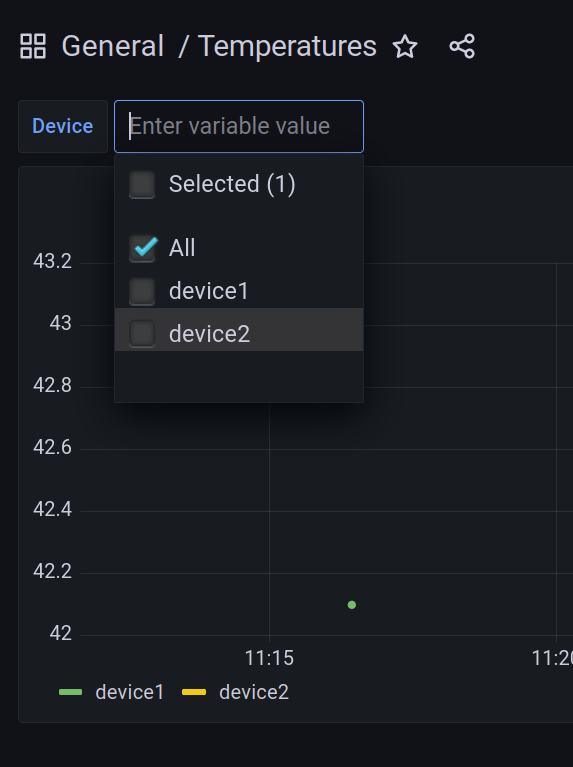
device_id variable|
Add more devices
Of course, as the screenshot might already have hinted, this is more fun when adding additional devices. Take a look at the previous sections. Adding more devices should only be a few clicks in the Drogue IoT console now. Also be sure to push some data using the HTTP or MQTT commands. |
What’s next?
Congratulations. We have our basic setup complete. We have set up all the different components, using managed services in the process.
Feel free to play around with this. We have a few ideas what you could try out in the summary of the workshop.
However, if you are curious, stick around for the next section, where we dig a bit deeper into the features of TimescaleDB. Showing you what benefits you can get over a standard PostgreSQL database.