Websocket Application
Now that we have events flowing into Drogue Cloud, it’s time to visualize the data. We’ll start of with a web assembly application consuming events from the Websocket integration of Drogue Cloud.
| You can use a pre-running instance of this application at https://drogue-iot.github.io/wasm-websocket-integration-example. |
Read on if you want to run this application locally as well:
Clone the Git repository
Clone the git repository with the integration example:
git clone https://github.com/drogue-iot/wasm-websocket-integration-exampleFor the next steps, make sure you have npm installed as listed in the prerequisites.
Installing the development tools
To build the WASM application and test it locally, we need the trunk tool:
cargo install trunkRunning the application
To build the application, we must first install the dependencies:
npm installOnce installed, we can build and run the main application locally:
trunk serve --port 8080Open your browser at http://localhost:8080, and you should see the temperature dashboard:
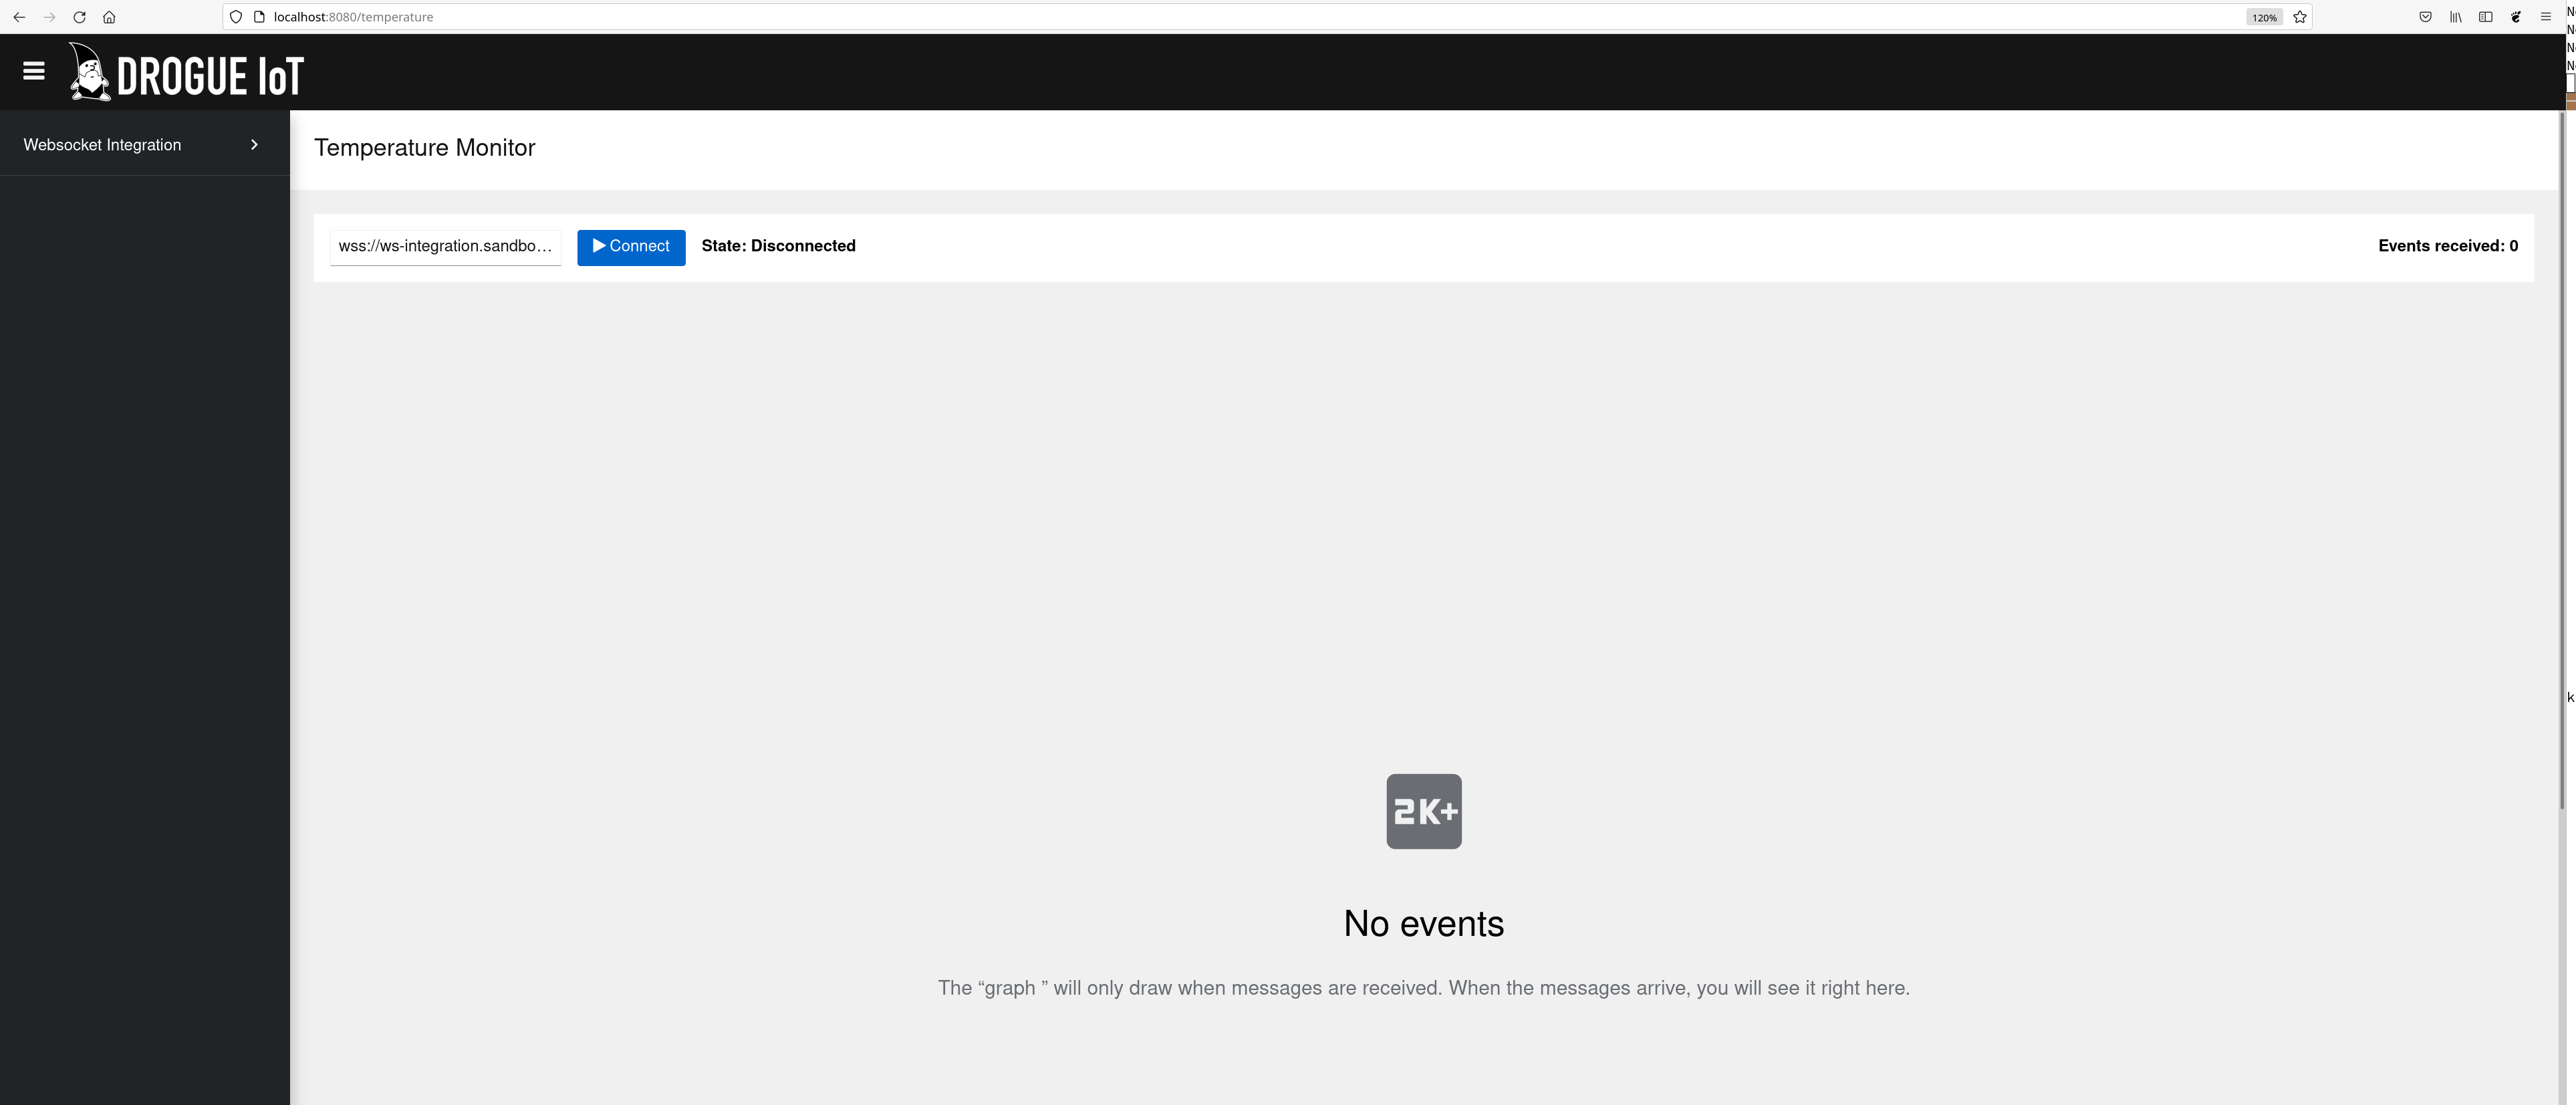
You can adjust the URL in the text field, but for this workshop you can just use the default URL.
Click Connect to start plotting temperature data. After running for a while, you should see a graph, like this:
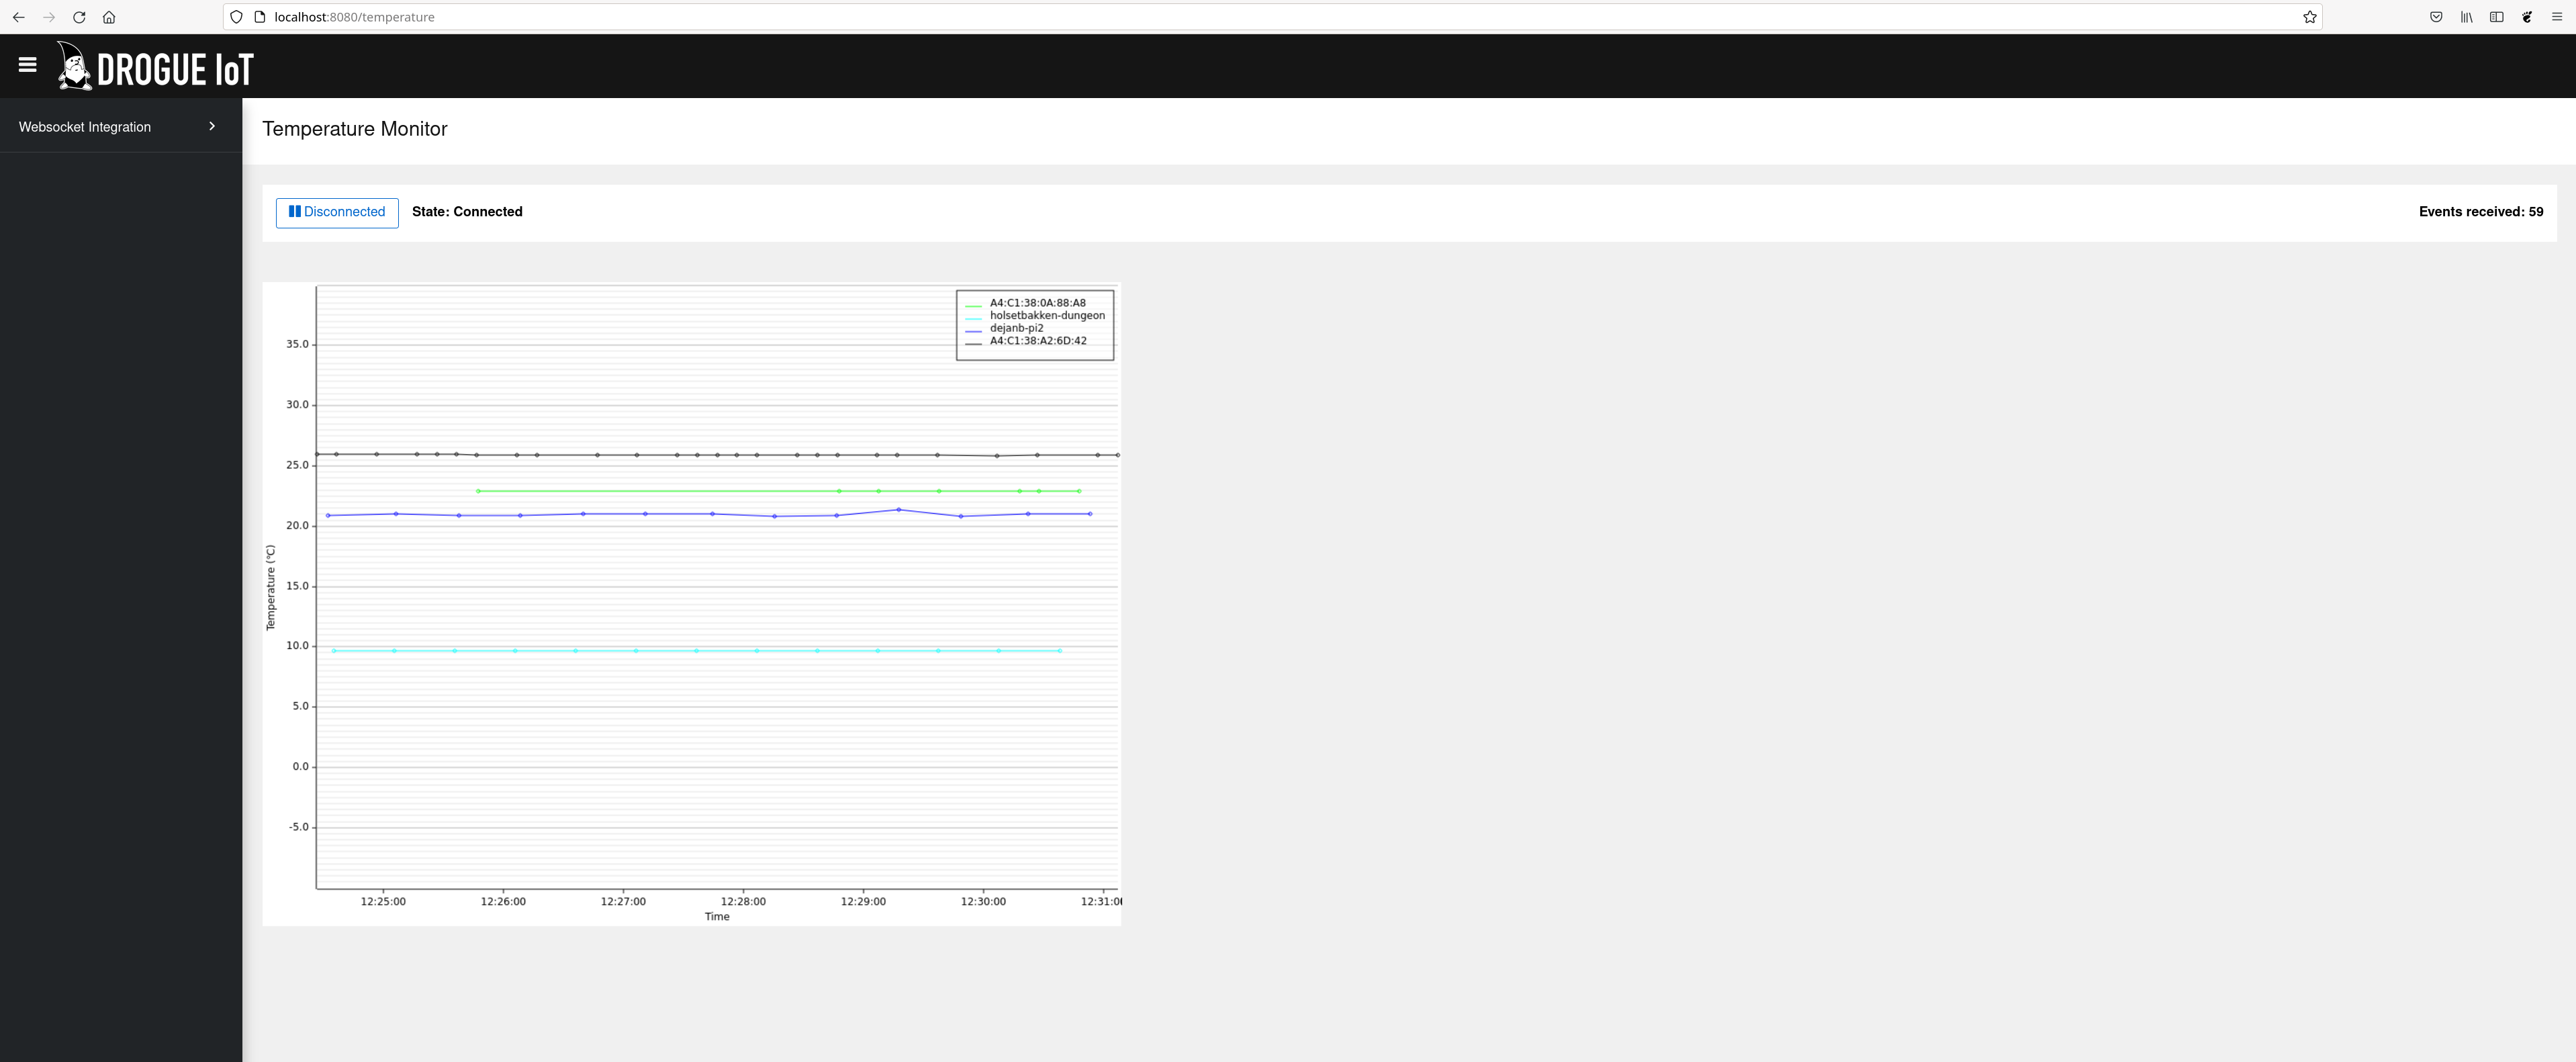
Feel free to play around with the application and use it as a base for creating more advanced visuals of the data.