TimescaleDB and Grafana
Having an easy way to visualize your data using Websocket application is great getting started experience. The next logical step for most applications is to provide a storage for the data along with the way to create custom dashboards. For this purpose, using TimescaleDB time series database based on Postgres and Grafana is a popular choice. For this purpose we provided a ready to use Helm chart that you can deploy in any Kubernetes cluster and get your IoT telemetry application ready to use.
Deploying
Let’s deploy this example and configure it to store and visualize our device temperature data. For that we will need Kubernetes cluster and Helm available on our machine. In this case we will use Minikube, but any other will work just fine.
First, you need to start the Minikube
minikube start --addons ingressConsidering, we have our Drogue Cloud properly configured in the previous section, we need to create an Access Token to connect to the sandbox.
$ drg admin tokens create

A new Access Token was created:

drg_HASH
Make sure you save it, as you will not be able to display it again.
Next, we’ll install the Helm chart using your username and the previously generated token
$ helm repo add drogue-iot https://drogue-iot.github.io/drogue-cloud-helm-charts/
$ helm install --dependency-update --set global.domain=.$(minikube ip).nip.io \
--set drogueApplication.name=wifi-workshop \
--set source.drogue.user=dejanb \
--set source.drogue.token=drg_HASH \
drogue-cloud-examples
Using
Now that we have our example up and running, we can take a look at our data in the dashboard.
First, you need to find out the ingress URL for your Grafana installation.
$ kubectl get ingress
NAME      CLASS    HOSTS                          ADDRESS         PORTS   AGE
grafana   <none>   grafana.192.168.64.86.nip.io   192.168.64.86   80      95s
Now, you can point your browser to https://GRAFANA_INGRESS_HOST (grafana.192.168.64.86.nip.io in this example) and login to the dashboard with admin/admin123456.
Your device temperature should show up in the Example dashboard similar to this
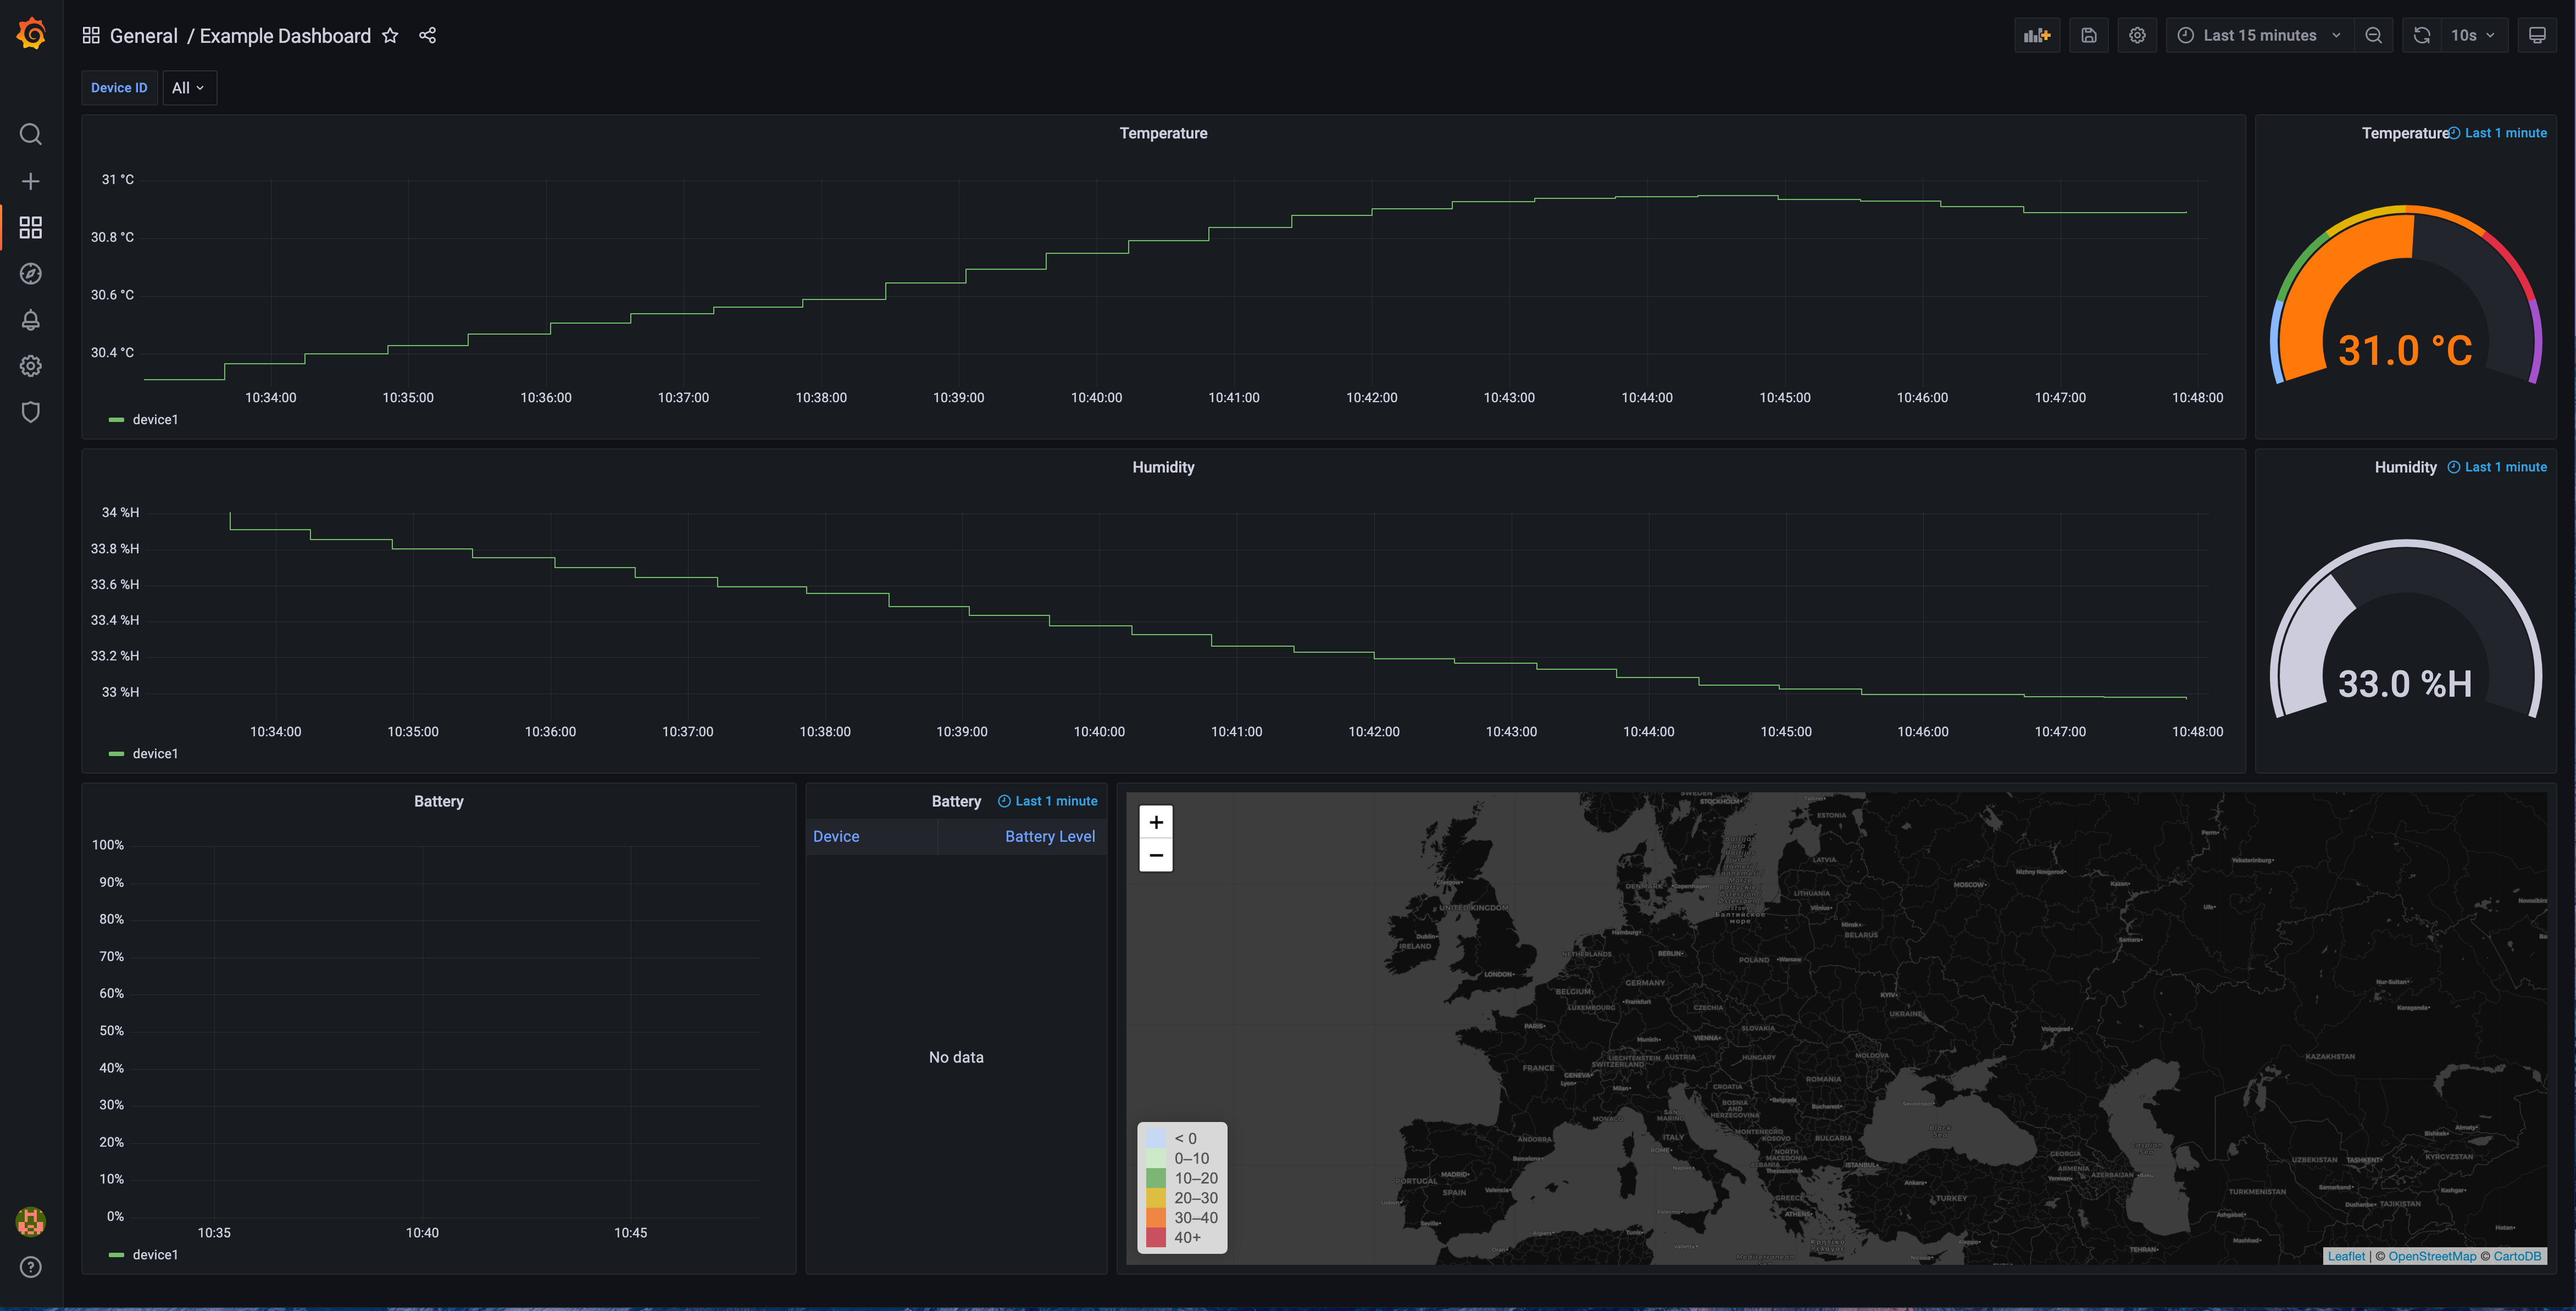
Feel free to play around with the dashboard and adjust it to your liking.