Visualizing Sensor Data
This workshop focuses on the use case of reporting data from an embedded device with a HTTP client, to the cloud and receive and visualize telemetry data.
The workshop is split into three phases. In phase one, we will use the embedded device to send temperature and humidity data to an instance of Drogue Cloud using a WiFi-capable development kit.
In the second phase, we will demonstrate the websocket integration of Drogue Cloud, and run a simple web application locally that consumes telemetry and creates a live graph of the temperature data.
In the third phase, we will deploy an application to the cloud that consumes the same telemetry data and storing it in a database, and uses Grafana to create a dashboard for our application.
Pre-requisites
This workshop requires additional hardware, as we need an embedded device with a WiFi modem.
Additionally to the common pre-requisites, you will need:
-
A GitHub account for logging in to the Drogue Cloud.
-
A Drogue Device supported development board and WiFi modem
-
Development tools: Git, Rust and Npm
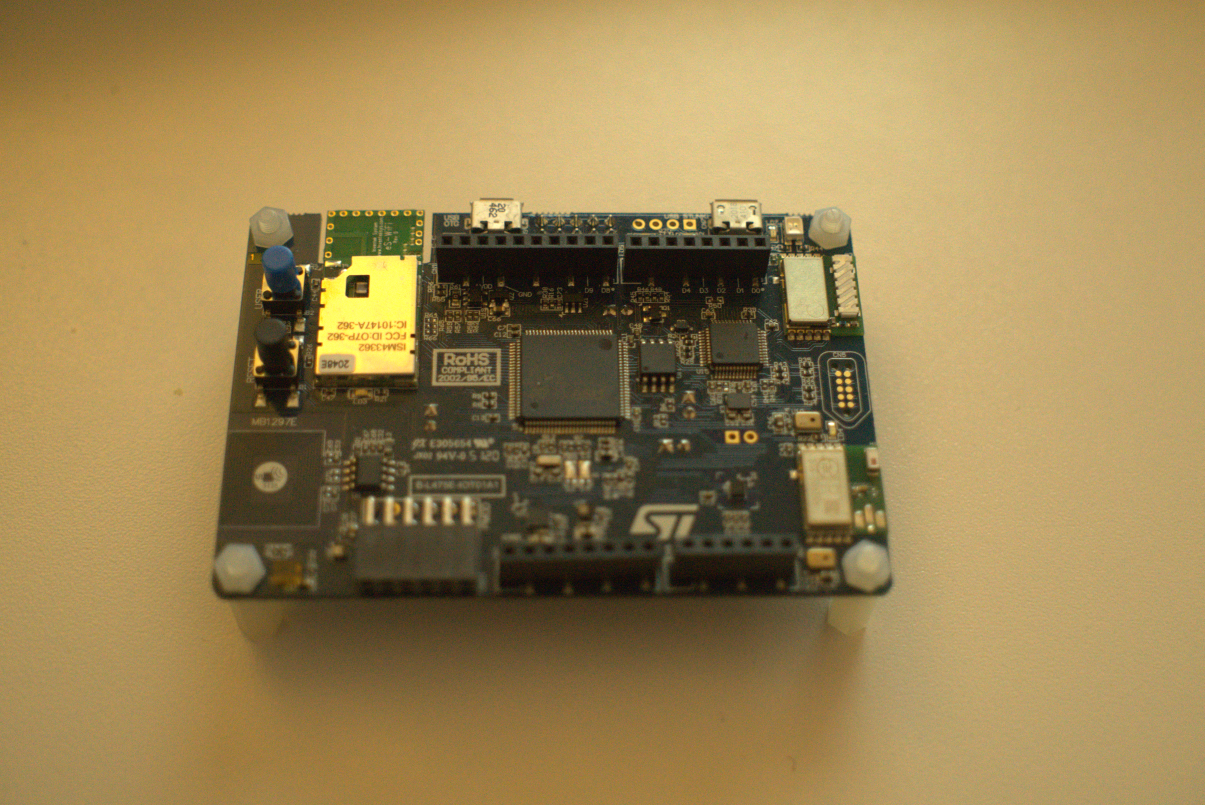
Supported embedded device
You need a board with network connectivity, such as the STM32L4 IoT Discovery Kit. You may also use a different board that can run Drogue Device. However, this means that you need to adapt the provided example firmware yourself.
Drogue Cloud
For this workshop, we recommend using the Drogue Cloud Sandbox, but you can use your own instance of Drogue Cloud if you do not wish to use the sandbox.