Simulating data
As we have an end-to-end IoT deployment now, we could use some more data. So, let’s generate some and see what we can do with it.
Device simulator
Of course, you can set up a device and publish real data to the device you configured. However, explaining this may take some time, and we would like to keep this example focused on part of processing the data on the cloud side.
| Of course, if you already have some devices that you feel comfortable hooking up to Drogue Cloud, you can do that too. |
So, for this workshop we are using our device simulator. Clicking on the following link, will open the simulator in your browser. It will simulate a device using MQTT over websocket, and comes pre-configured with a sine wave generator, which generates an artificial temperature value.
| You will need to update the device credentials (application, device id, password) on the connection screen after loading. |
Click here: open simulator
Update credentials
Update the credentials on the "Connection" page. Activate them by pressing the Apply button.
|
Persisting configuration
By default, all changes made to the simulator instance are temporary. Closing the browser tab will simply discard them. If you want to persist the changes, you can store one configuration as default. Navigate to the "Configuration" page, and click on the Set as default button. |
Start the connection
In order to let the simulator send data, you need to start the connection by pressing on the ▶ button in the top right navigation area.
Send data
Once the simulator is connected, it will start sending data towards the system with a 250ms update period. You should also see the data coming in the Grafana dashboard.
Keep the simulator running for a while, and don’t close the tab. Maybe grab a coffee and check out the data when you come back.
Maybe also disconnect the simulator for a few minutes, and reconnect it afterwards, letting it push some more data (simulating a gap in the data too)
Improving the dashboard query
Now that we have more data pushed to TimescaleDB, let’s focus on the dashboard query a bit. The current query we have in Grafana is a pretty basic one. Great to get started, but TimescaleDB can do way better.
Let’s take a look at the following query:
SELECT $__timeGroup("time", $__interval, NULL), device_id as metric, avg(avg(temperature)) OVER w as temp
FROM temperatures
WHERE
  $__timeFilter("time") AND
  device_id = ANY(ARRAY[$device_id]::varchar[])
GROUP BY time, device_id
WINDOW w as (PARTITION BY device_id ORDER BY time RANGE '1 minute'::INTERVAL PRECEDING)
ORDER BY time, device_id
In a nutshell, this query takes the data, and builds a moving average over a time period of 1 minute. Partitioning the
data by device, so that the moving average is build for each device, instead of over all devices. It will also not just
skip gaps, but actively report them using NULL as value. This can be used in Grafana to make the user aware of
the gaps, rather than just drawing a straight line.
In addition to the existing query, add a new panel in the Grafana dashboard, using the query from above. Apply and save, and then take a look at the different visualization of the data:
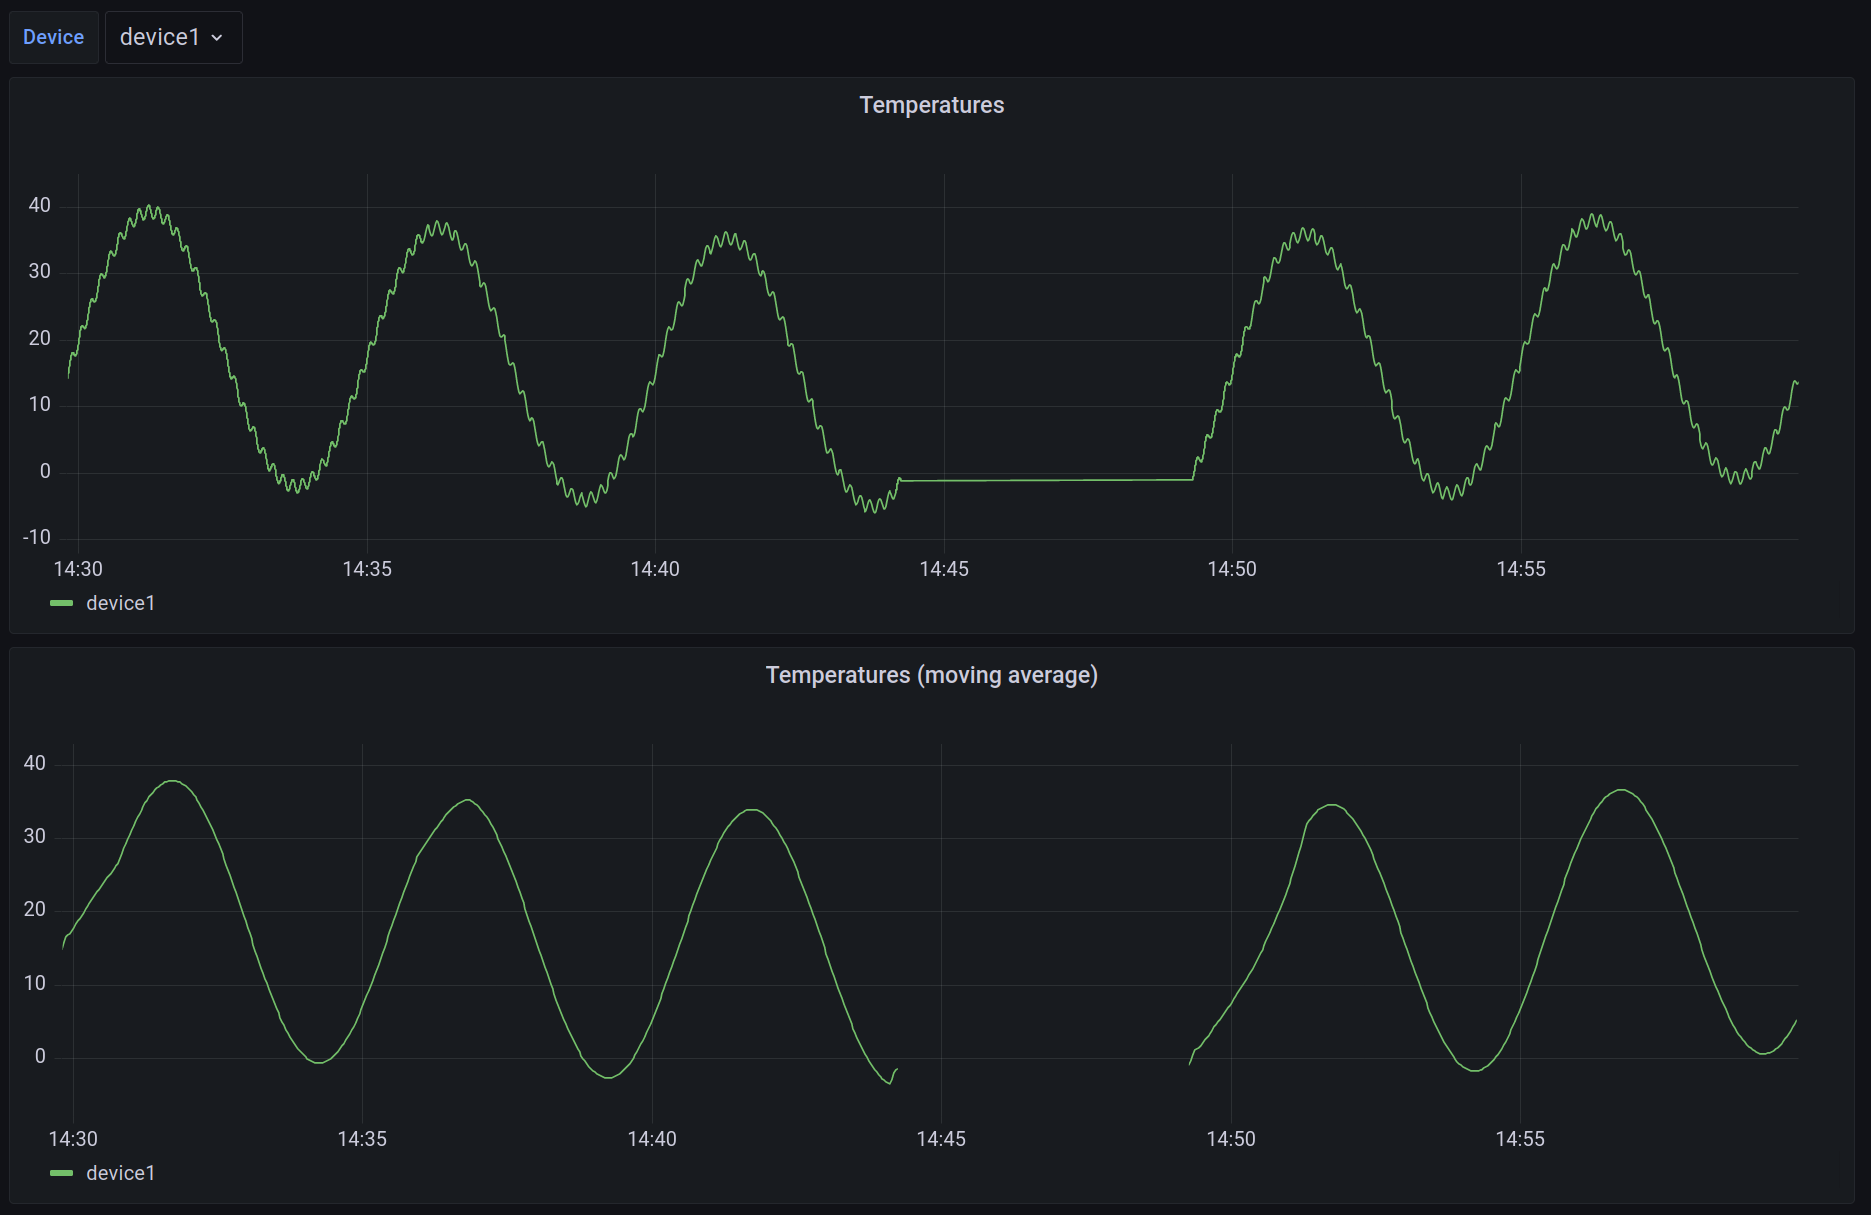
You can see that the measurement is much smoother now. Still, internally you have the actual, raw data available. Also, it is pretty easy to spot the gap in the data. In both variants. Bust just assume how that would look if the data would not be in such a predictable pattern. You might actually miss if the sensor value is a flat line, or if it was a gap in the data.